Key Performance Indicator Reporting Tools Follow
How to Use KPI Reporting Tools in AI Growth Advisor
AI Growth Advisor’s KPI Reporting tools let you easily track, visualize, and manage your most important business metrics in one place. Follow these steps to get the most out of your KPI dashboards and scorecards.
1. Log In and Access Your KPI Dashboard
Sign in to your AI Growth Advisor account.
In the left sidebar, click Scorecard to access your KPI dashboards.
2. View and Understand Your KPIs
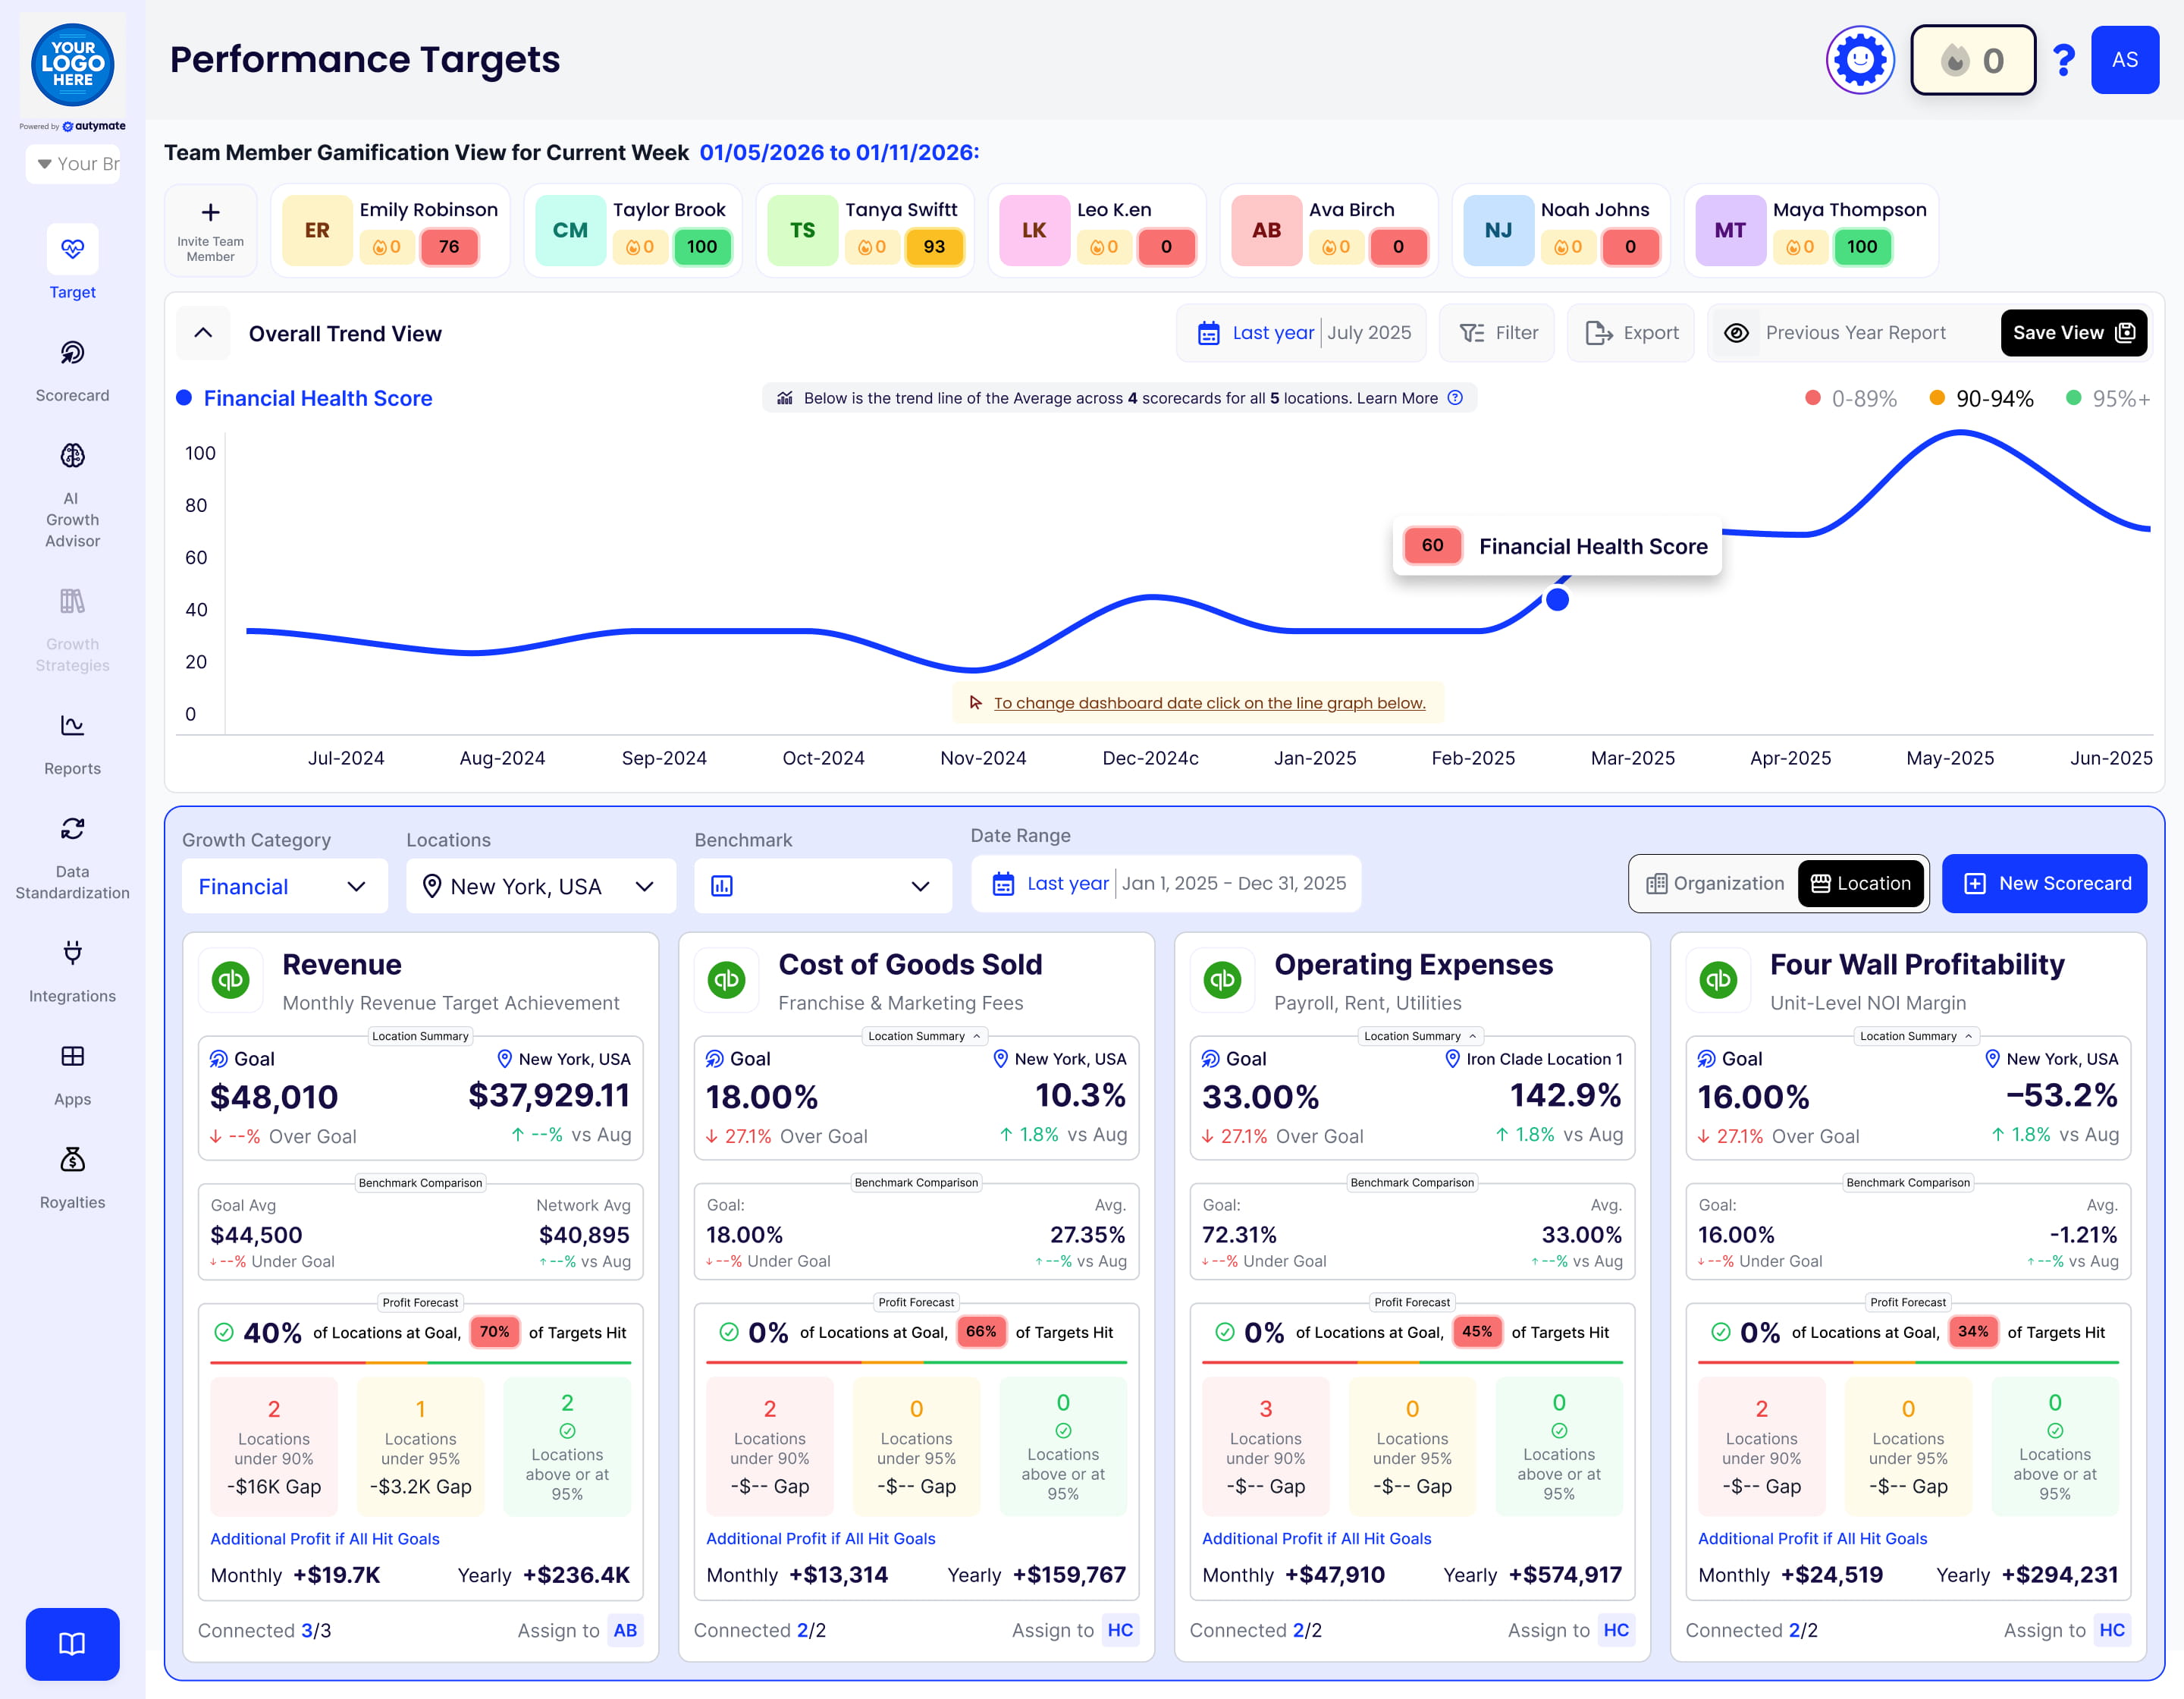
The dashboard displays key metrics—such as AR Aging, Financial KPI Monitor, Expense Control Dashboard, and QuickBooks Online P&L—each as a color-coded card.
Each card shows the current score (e.g., 30, 60, 90), a colored progress bar (red, yellow, green), the connected data source, and a brief metric description.
Scan your dashboard to instantly spot issues (red), warning areas (yellow), and successes (green).
3. Drill Down for Details
Click on any KPI card to see more information, including historical trends and details about how the metric is calculated.
Use scorecard filters to narrow your view by score, data quality, location, region, responsible party (RP), or other custom attributes.
You can quickly identify and focus on areas that need attention.
4. Customize Your Scorecards
Add or edit KPIs by clicking the Edit button.
Personalize scorecards by setting goals for each metric, assigning responsible parties, and writing clear descriptions.
Use the Add Metric function to incorporate additional KPIs relevant to your business, or create entirely custom scorecards.
5. Integrate Your Business Apps
Connect your data sources (such as QuickBooks, Google Analytics, Shopify, Stripe, and more) to ensure your KPIs always display the latest information.
The AI Growth Advisor automatically syncs your data, keeping your dashboards up to date in real-time.
6. Use Real-Time Filters and Views
Adjust the date range to view current, past, or custom periods for your KPIs.
Switch between different scorecard views (grid, team, map, or list) for the perspective that works best for you.
Filter by metrics or responsible party to focus on individual or team performance.
7. Track Progress and Take Action
Regularly check your KPI dashboard to monitor performance.
Use the color-coded progress bars to identify low-performing areas and quickly celebrate wins.
Take action on issues by assigning follow-up tasks to responsible parties or scheduling a team review.
8. Get Help or Schedule a Demo
If you need assistance, use the feedback button in the app or schedule a demo with the AI Growth Advisor team to walk through KPI setup and best practices.
By following these steps, you’ll have a powerful, visual, and actionable KPI reporting process—keeping your team aligned, focused, and ready to drive business growth with AI Growth Advisor.
Comments
0 comments
Article is closed for comments.